News
We had our climate impacts calculated: Saalasti’s carbon footprint and Hippo’s handprint

Our commitment to environmental responsibility extends to our own operations, and thus, it was only natural for us to assess our climate impacts based on calculations. Our primary focus in our operations is to provide our customers with technology services that support the transition to a low-carbon future.
We calculated Saalasti’s organizational carbon footprint, considering our own, scope 1 2 emissions, and emissions from our value chain (scope 3).
Additionally, we conducted a handprint study of Saalasti’s High-Pressure Hippo. It was essential for us to understand the positive climate impacts our solutions can offer.
Compared to the prevailing method of drying biomass, the Hippo machine saves greenhouse gas emissions.
The studies were conducted by a Finnish environmental specialist, UseLess Company, whose speciality lies in life cycle assessment (LCA), including carbon footprint calculations.
How was the carbon footprint calculated?
The carbon footprint study was conducted using the GHG (Greenhouse Gas) protocol, the most used standard for calculating organizational carbon footprint.
This standard helps evaluate an organization’s climate impacts in a reporting year.
In GHG protocol, greenhouse gas emissions are divided into three categories called scopes:
- Scope 1 emissions are those directly generated by a company’s operations, such as facility and vehicle use.
- Scope 2 emissions consist of indirect emissions of energy production, primarily from electricity and heating.
- Scope 3 emissions are indirect emissions that occur in a reporting company’s value chain and are for example, related to production, transportation, and use of sold products. These emissions are not directly under the organization’s control but can be influenced through partnership choices and customer guidelines.
Scope 3 emissions are further categorized into upstream and downstream emissions:
- Upstream emissions pertain to the supply chain and early stages of process, including emissions from the production of products and services.
- Downstream emissions occur after a product has left the customer’s premises. They are associated with product usage, distribution, and the end phases.
Saalasti Finland Oy carbon footprint 2022:
The total carbon footprint of the company was 22 512 tCO2e (carbon dioxide equivalent)
The top three emissions sources were:
- 88.1% Use of sold products
- 10.0% Purchased goods & services
- 0.44% Business travel
Compared to other CO2 footprints:
- Average Finn 10 tCO2e (Sitra, 2018)
- City of Helsinki 2 349 000tCO2e (HSY 2021)
- Finland 45 816 000 tCO2e (Tilastokeskus 2022)
Showing the carbon footprint without the category of “use of sold products” is important to provide a comprehensive view. When the largest emitter of emissions has been removed, the relationships between other categories become more distinct.
And without taking into account the category of use of sold products, the results are:
The total carbon footprint of Saalasti company: 2671 tCO2e.
Top emission sources:
- 84.5% purchased goods & services
- 3.7% business travel
- 3.1% upstream leased assets.
But what should be considered when we talk about the largest portion of the carbon footprint, which is the use of sold products (machines) delivered to our customers?
Even though the products we produce reduce significant amounts of energy, it is important to note that reducing emissions in the value chain is not solely within our control. However, emissions from the energy sector are expected to decrease globally in the coming years, reducing the climate impact of this category.
As our CEO Petteri Korpioja puts it:
Our most significant climate impact lies in our ability to help our customers reduce their emissions. Also, our R&D people are constantly developing our products to find even more energy-efficient solutions for our customers.
“Compared to other players in the industry, our solutions are remarkably energy-efficient. Therefore, our solutions should be compared to other players, as looking at the carbon footprint alone doesn’t tell the whole story.”
The results for Hippo
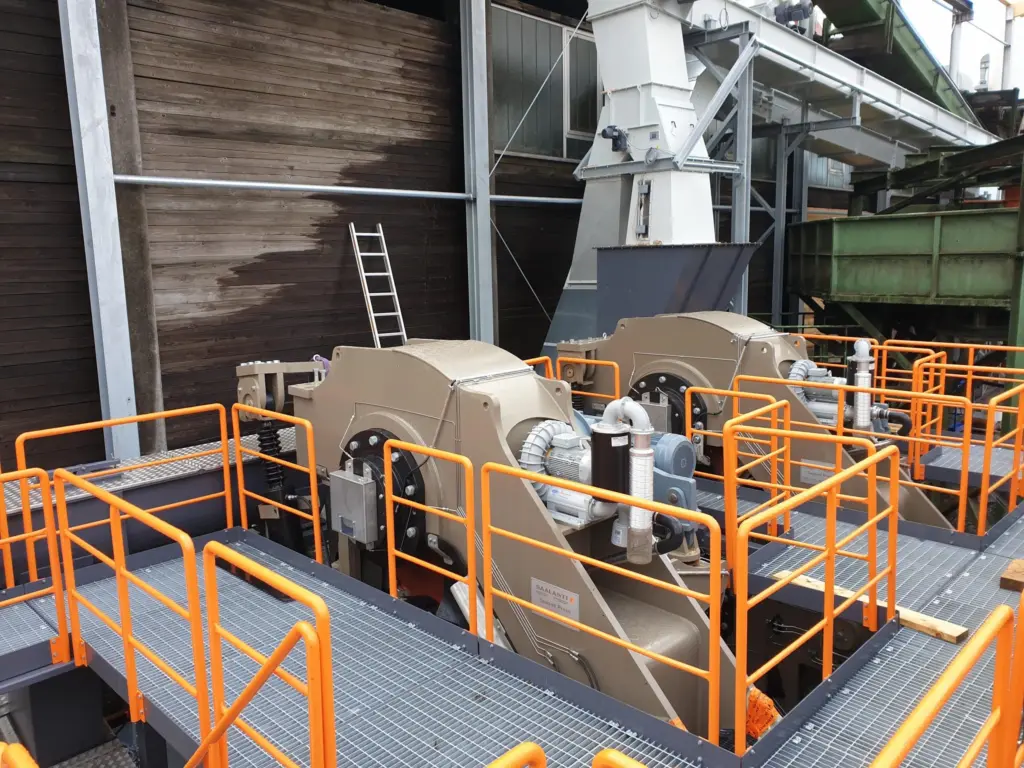
The Saalasti High-Pressure Press 1803, also known as Hippo, is a high-pressure press that relies on mechanical dewatering capabilities for its efficiency. Mechanical drying reduces the moisture content in biomass and significantly increases its calorific value.
Hippo’s efficient drying process significantly reduces the moisture content of biomass, leading to significant energy savings. This can be achieved when auxiliary fuel (often fossil-based) can be reduced or eliminated during the drying process. When the material is drier, its heating value is higher, and less biomass is needed.
Carbon footprint of Hippo, total
Carbon footprint of Hippo, total cradle-to-customer
| Customer location | Product manufacturing [kgCO2e] | Transportation of the components to Saalasti [kgCO2e] | Transportation, product to customers [kgCO2e] | Total [kgCO2e] |
|---|---|---|---|---|
| Canada | 76 991 | 3 071 | 10 764 | 90 826 |
| Sweden | 76 991 | 3 071 | 676 | 80 738 |
| Chile | 76 991 | 3 071 | 16 325 | 96 387 |
| Portugal | 76 991 | 3 071 | 10 447 | 90 509 |
| Spain | 76 991 | 3 071 | 9 610 | 89 672 |
| France | 76 991 | 3 071 | 7 117 | 87 179 |
- The carbon footprint of the product manufacturing is the same, regardless of which country the machine will be delivered.
- Transportation components to Saalasti are also the same, 3 071 kgCO2e.
- Thus, variation occurred in transportation due to different locations and transportation methods. Transportation emissions varied from Sweden’s 676 kgCO2e to Chile’s 16 325 kgCO2e.
Emissions from component production and transportation are the same despite the customer location because production occurs in Finland, and differences occur when the device is transported to the customer. Naturally, the number of transportation kilometres and mode of transportation affects transportation emissions.
And what about carbon handprint?
It’s not just about negative climate impacts; the carbon handprint is significant regarding climate effects. Calculating the carbon handprint reveals positive climate effects in contrast to prevailing practices.
A carbon handprint represents the reduction of the carbon footprints of others.
The carbon handprint can be considered the counterpart to the carbon footprint, representing the reduction of carbon emissions in the value chain resulting from specific actions of a reporting company.
The carbon handprint is calculated by comparing the climate impacts of two similar products or services. It is determined by subtracting the carbon footprint of a company’s product from the baseline carbon footprint.
The calculation of carbon handprint is based on the ISO 14067 standard.
After establishing the baseline, the reduction in emissions needs to be quantified using standardised measurement and verification processes.
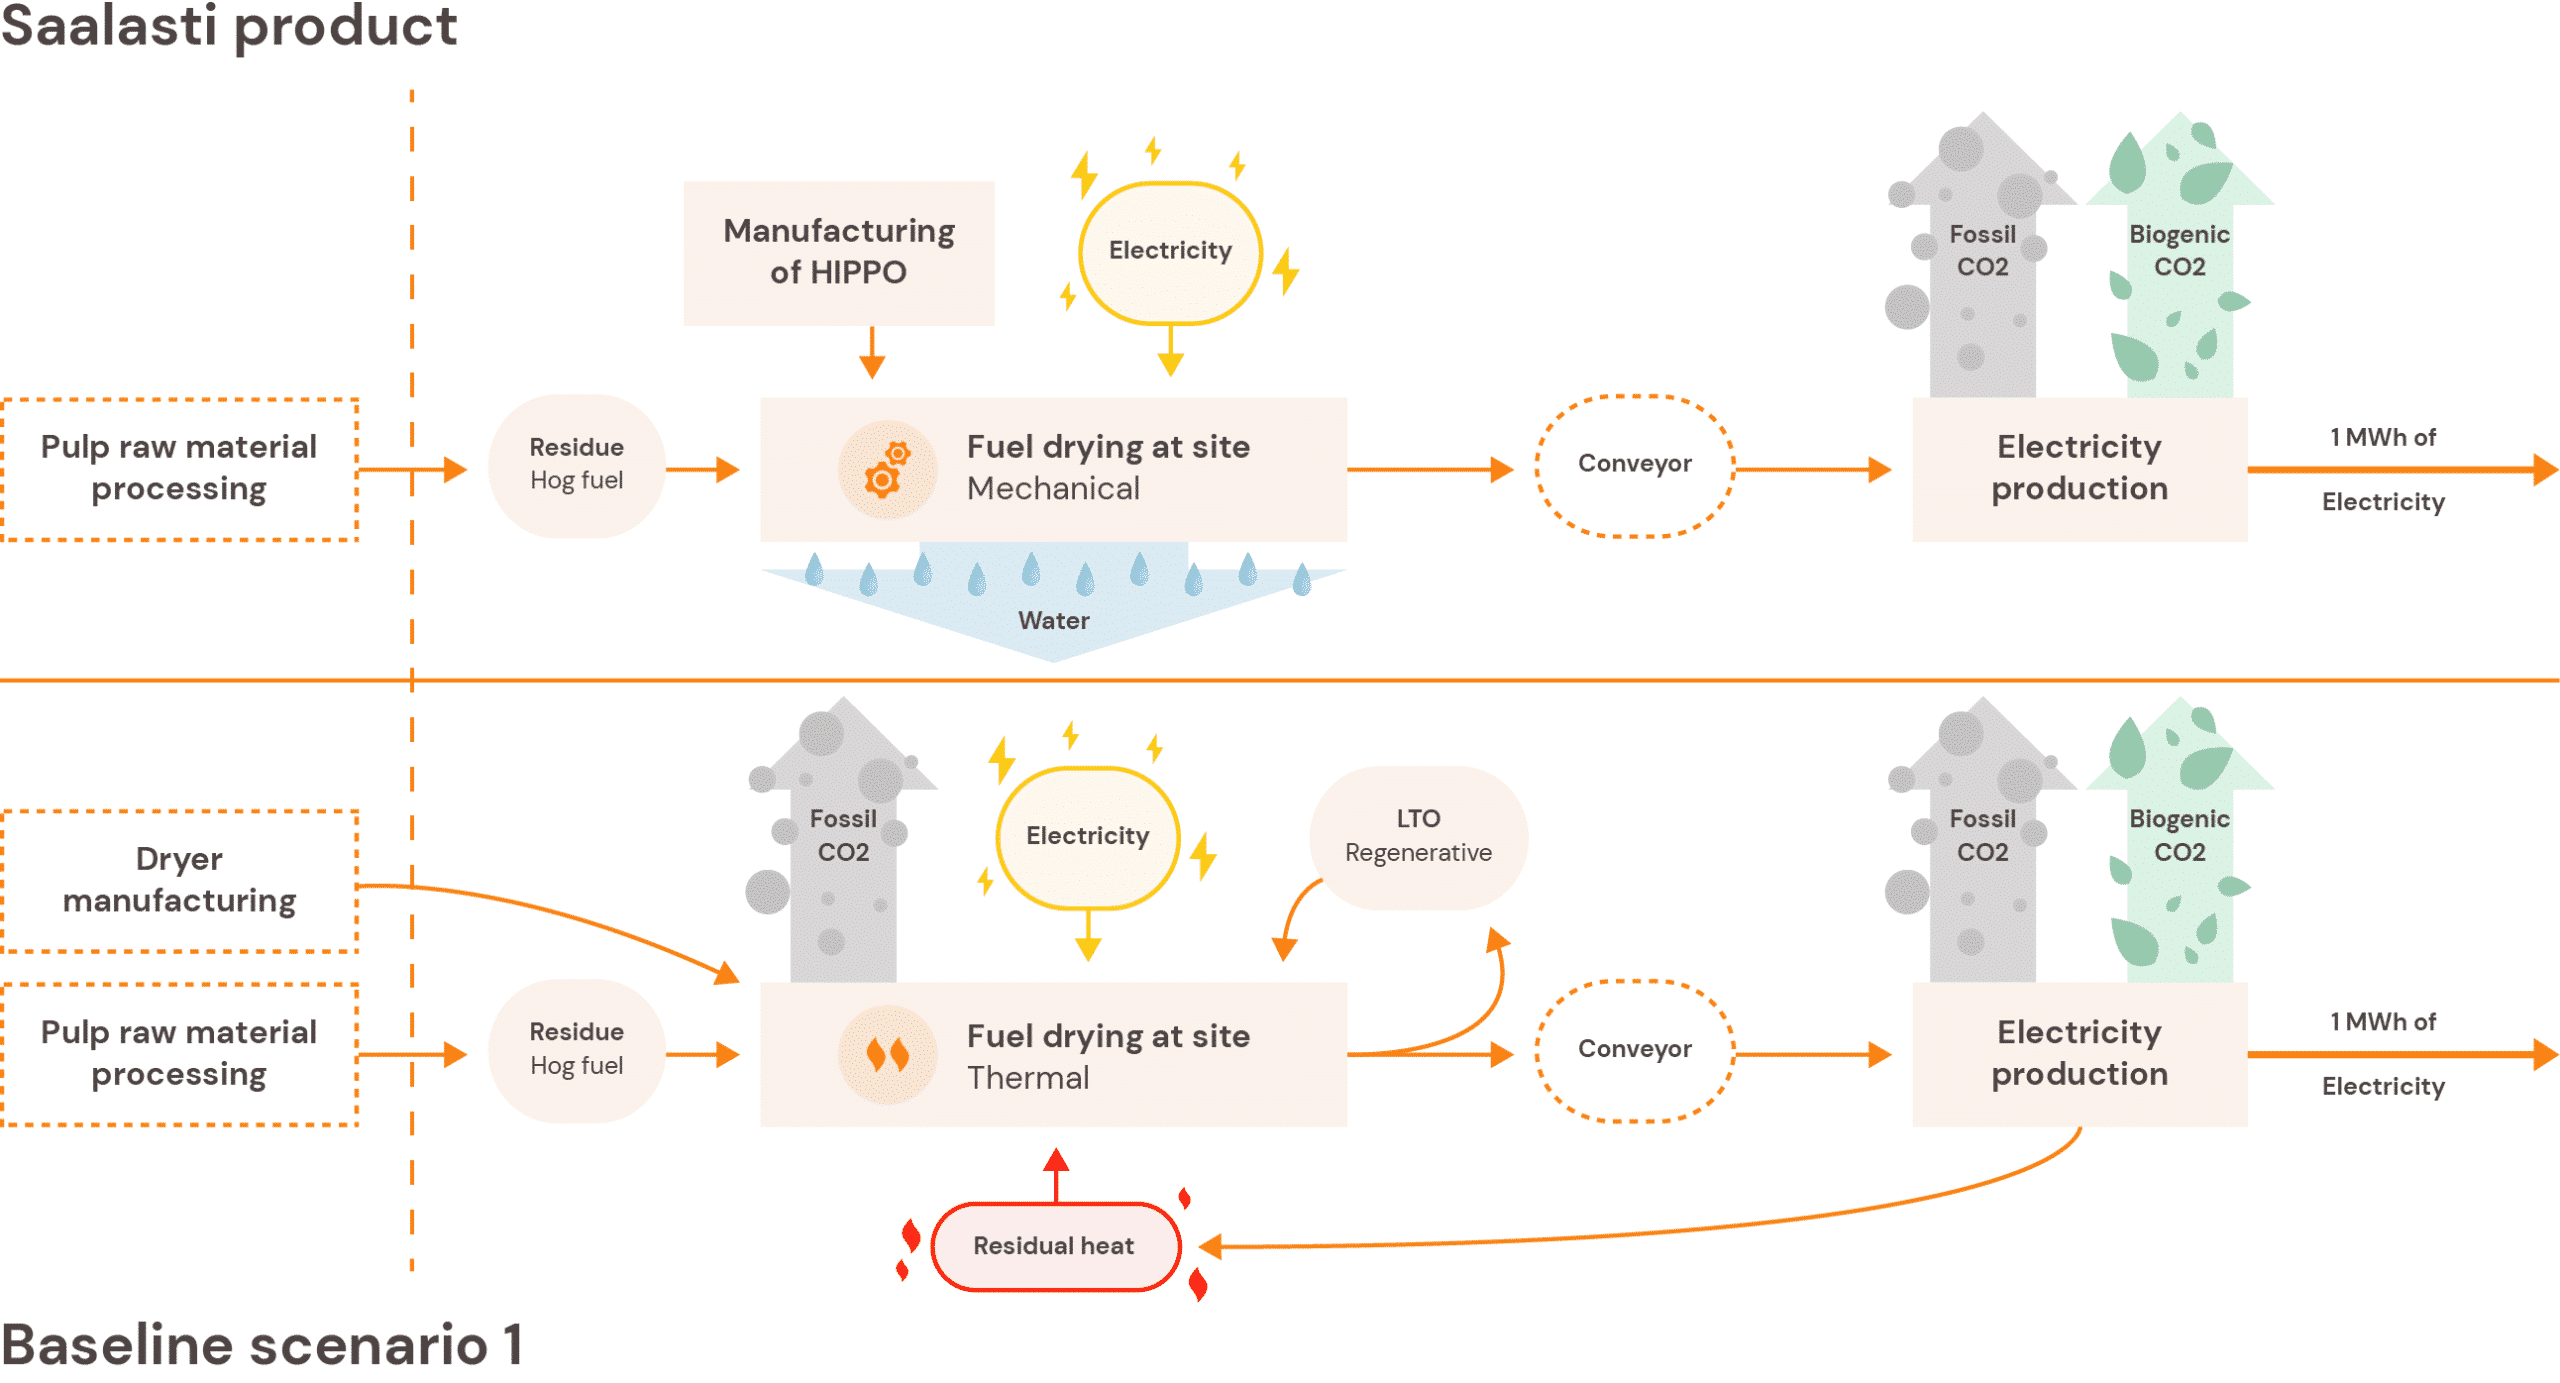
Handprint calculated: How does Hippo compare with other solutions in biomass drying?
In Saalasti’s case, the carbon footprint of the Hippo machine was compared to two other solutions in the pulp mill case.
In baseline situation 1, there was a thermal dryer on the site before the decision to switch to a mechanical dryer.
- The heat used in the thermal dryer is derived from waste heat generated by the power plant.
- The electricity comes from the power produced within the mill’s power plant.
- All direct carbon emissions are assumed to originate from biogenic sources. Additionally, the calculation includes other greenhouse gases, such as methane (CH4) and nitrous oxide (N2O), emitted from combustion. Indirect emissions from fuel transportation are also factored into the calculation.
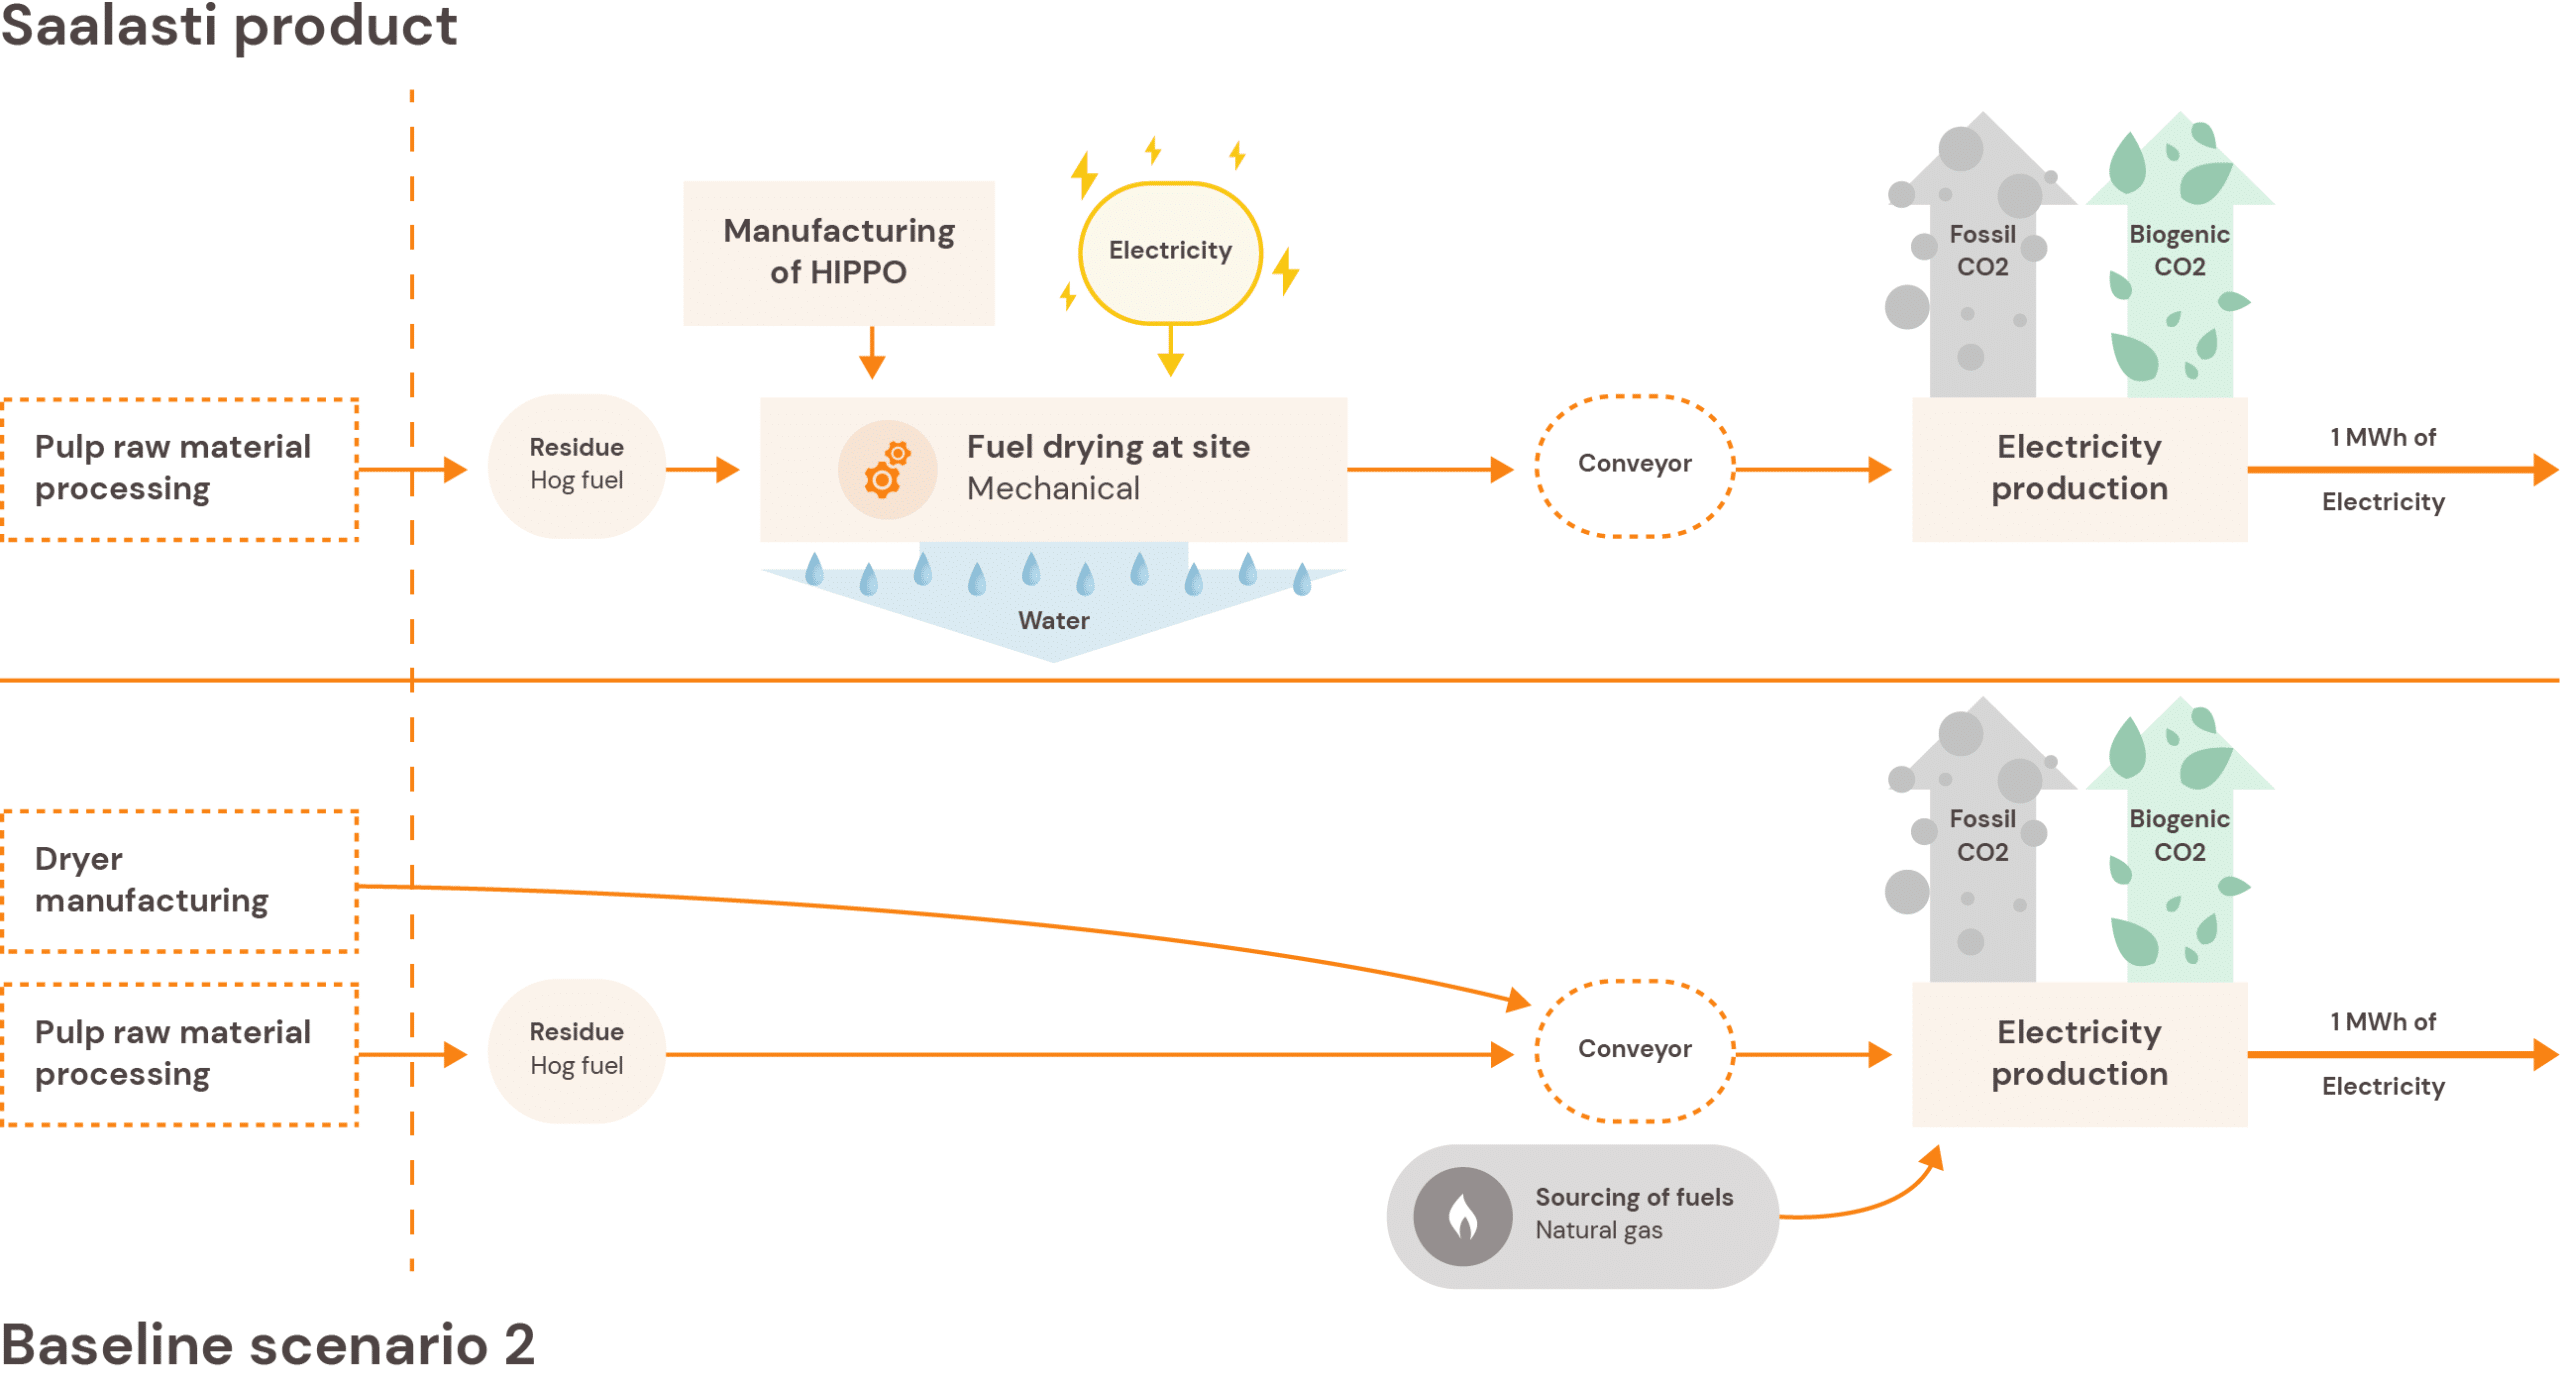
In baseline situation 2, there is no fuel drying in place before feeding the fuel to the power plant.
- The priming fuel is assumed to be introduced to the power plant to sustain a sufficiently high operating temperature.
- The quantity of priming fuel required is estimated to be equivalent to the energy required for vaporizing the same volume of water from the fuel as what is extracted during mechanical drying with Hippo.
- Natural gas is assumed as the priming fuel, and no losses from the combustion of natural gas are considered.
The results of baseline solutions
Results: Case pulp mill, baseline
| Emission source | Emissions in baseline solution scenario 1 [kgCO2e/MWh] | Emissions in baseline solution scenario 2 [kgCO2e/MWh] |
|---|---|---|
| Electricity used in dryer | 1,41 | 0 |
| Electricity used in conveyer | 0 | 0 |
| Natural gas used in thermal dryer | 0 | 50 |
| Emissions from burning residue (fossil) | 0 | 0 |
| Emissions from burning residue (biogenic) | 0 | 0 |
| Total emissions (fossil) | 1,41 | 50 |
And how does the Saalasti solution compare the baseline solutions? It can be seen that there are less emissions in Saalasti technology.
Hippo can save energy compared to baseline solutions.
Results: case pulp mill, handprint
| Emission source | Emissions in Saalasti solution [kgCO2e/MWh] |
|---|---|
| Saalasti product manufacturing and transportation | 0,06 |
| Electricity used in dryer | 0,2 |
| Wastewater treatment | 0,1 |
| Electricity used in conveyor | 0 |
| Natural gas used in thermal drier (not valid for Saalasti) | 0 |
| Emissions from burning residue (fossil) | 0 |
| Emissions from burning residue (biogenic) | 0 |
| Total emissions (fossil) | 0,4 |
For companies utilizing the Hippo, its usage enables a reduction in CO2e emissions compared to the prevailing practices in the industry.
Overall results of carbon handprint
Compared to other solutions, Saalasti’s technology generates significantly less carbon dioxide emissions.
Carbon handprint of in case pulp mill: 25,3 kgCO2e / produced MWh
| Total emissions (fossil) | Emissions in Saalasti solution [kgCO2e/MWh] | Emissions in baseline solution, average of scenario 1 and 2 [kgCO2e/MWh] |
|---|---|---|
| 0,43 | 25,71 |
Example: Annual handprint of 100 MWh power plant
- Annual production: 792 000 MWh
- Carbon handprint per year: 20 023 tCO2e
- Equals annual emissions of approximately 2000 Finns
Advocating for the green transition
At the heart of all our calculations is that we want to validate our impact based on measured data. We are committed to reducing our climate footprint in close cooperation with our stakeholders.
Saalasti’s CEO, Petteri Korpioja, encapsulates our mission:
“We are delighted to learn that Hippo’s carbon handprint is comparable to baseline solutions. Naturally, we had a hunch, but now we also have a calculated result.”
At Saalasti, we work diligently to provide our customers with solutions that drive the green transition. The handprint calculations of Hippo affirm that we are firmly on the right path.
The information derived from carbon footprint calculations is also valuable for Saalasti’s employees and partners.
“Furthermore, we gained valuable and measurable insights into Saalasti’s carbon footprint, which is also crucial for our operations as we aim to reduce it.”
Contact us to hear more!
CEO Petteri Korpioja
petteri.korpioja@saalasti.fi
Read next: Wood fibers in growing media: the potential to replace peat in a more sustainable way